Admin console
A map of the operator's console — the governance screen, the screens you use daily, and the diagnostic ones you open only when needed.
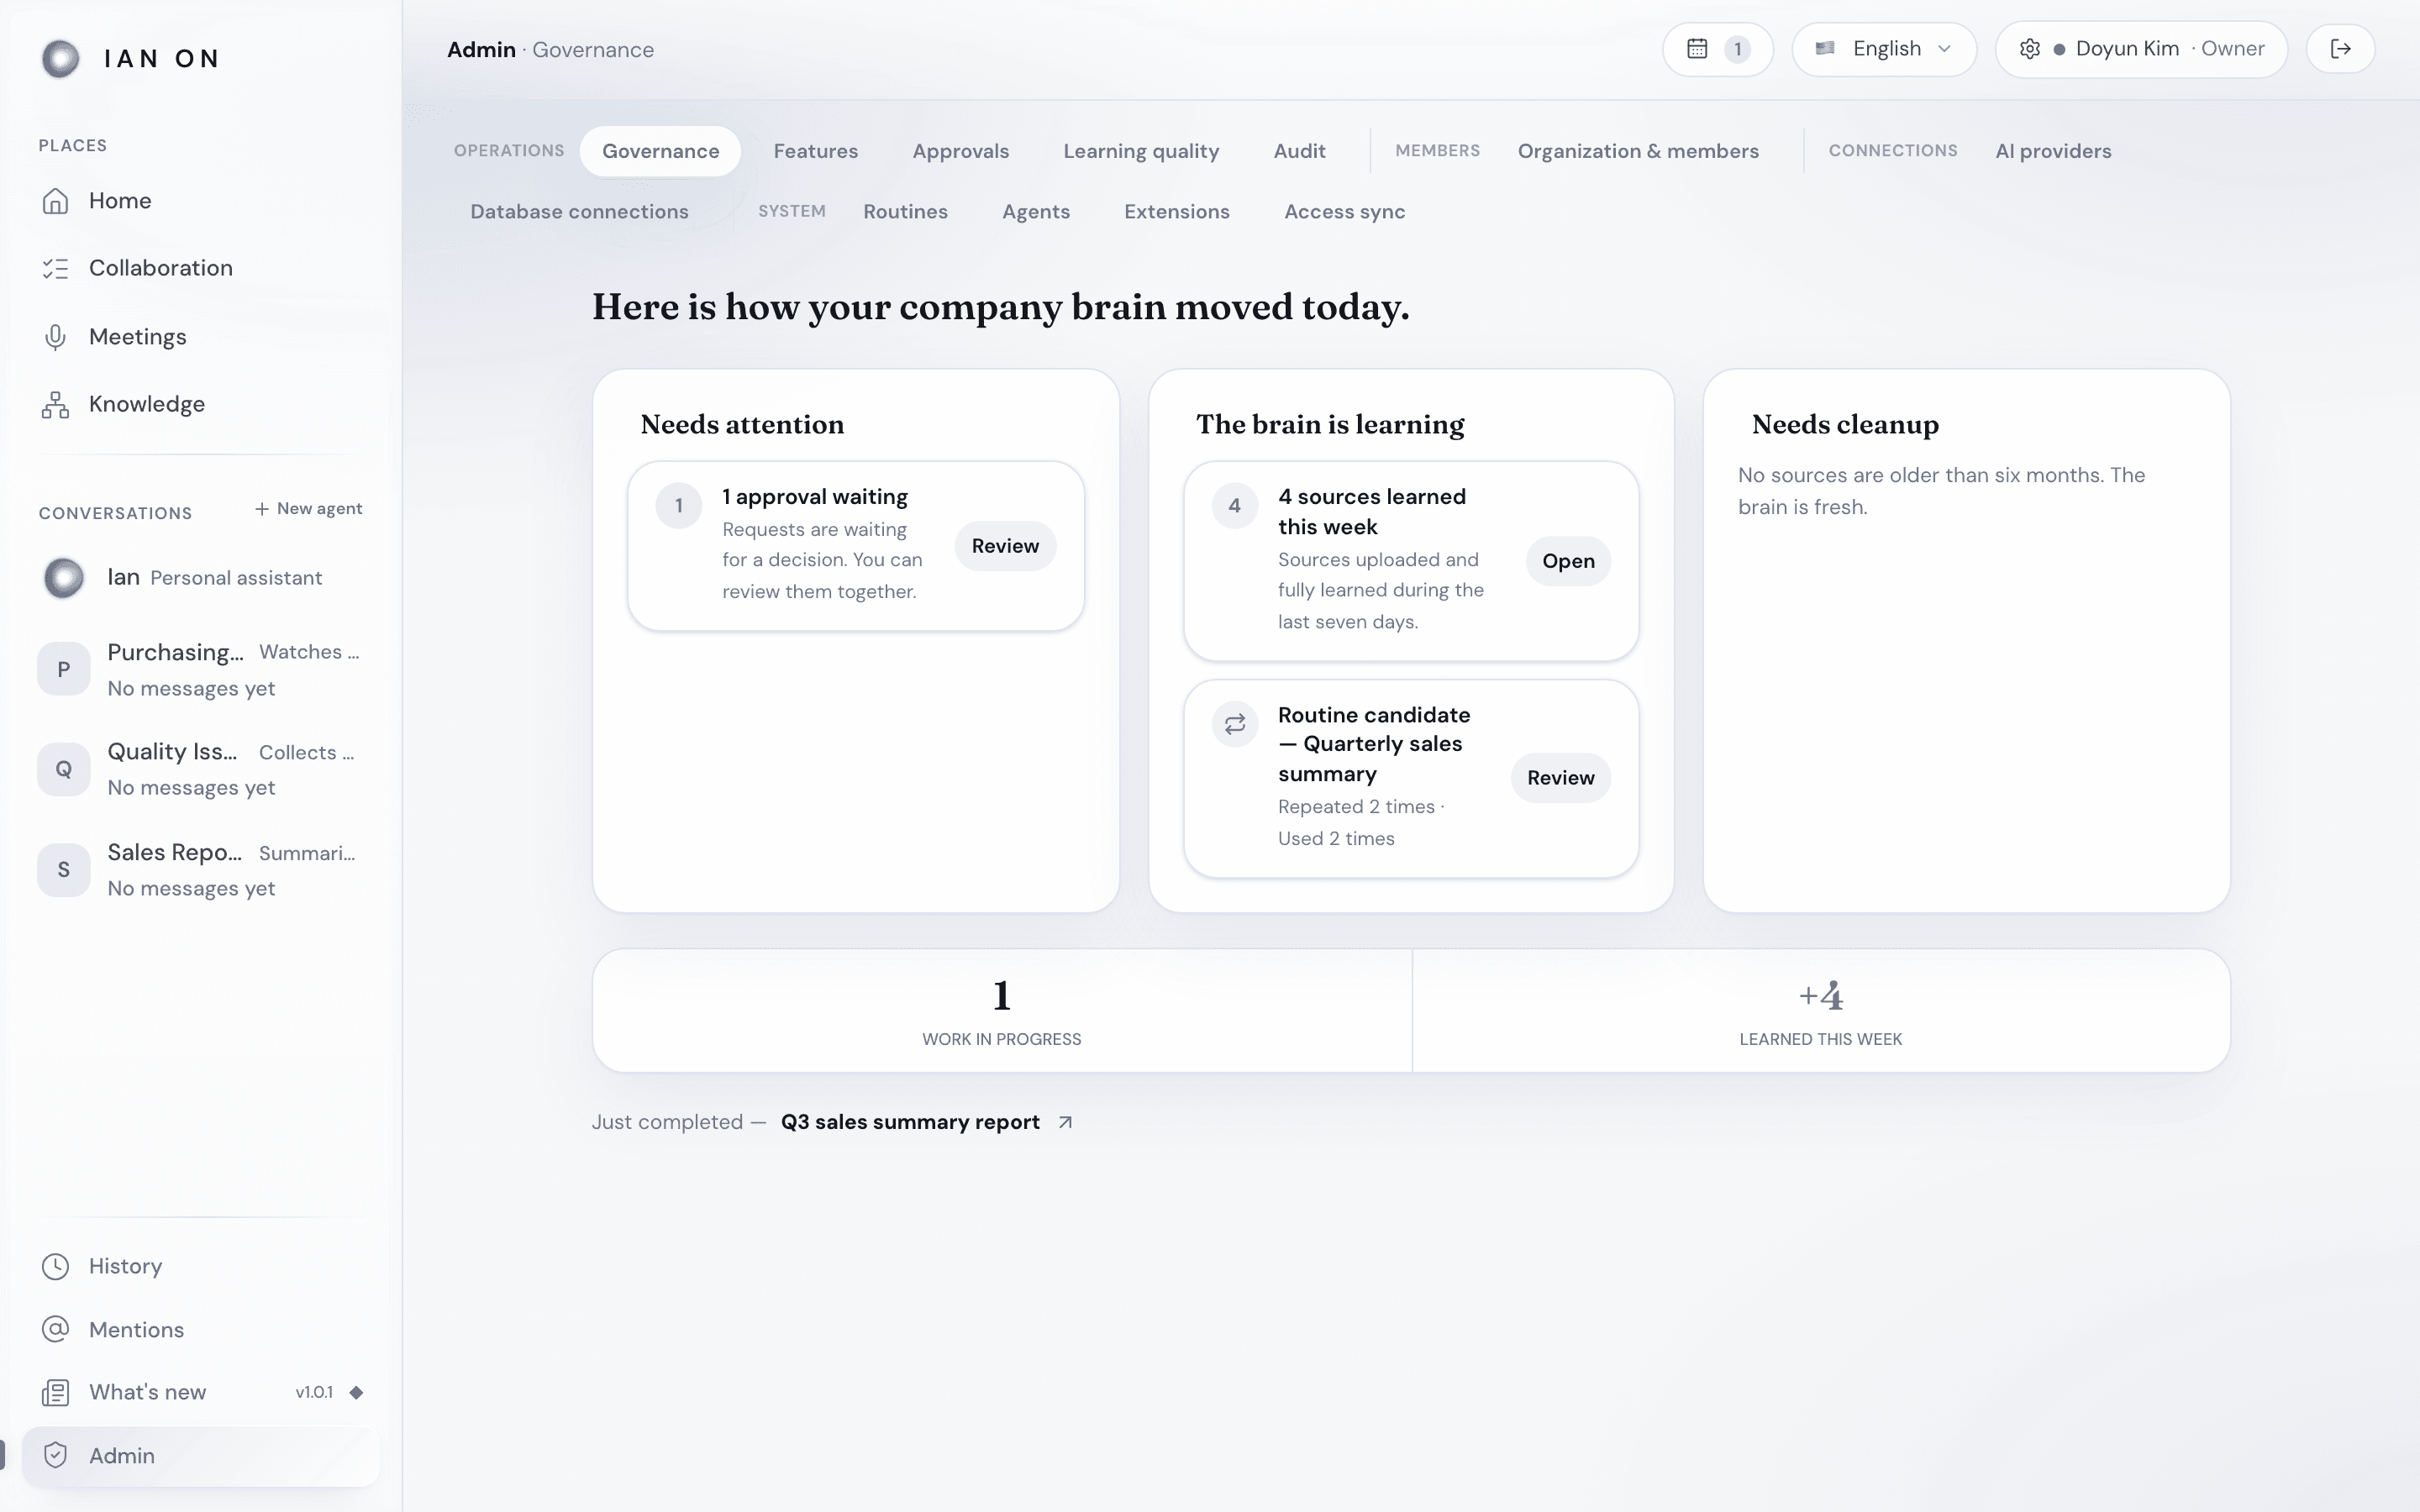
Admin is the operator's area, visible only to owners and admins. Its screens appear at the top as a row of chips in four groups: Operations, Members, Connections, and System. This page is the map.
The governance screen
The first screen, Governance, isn't a pile of charts — it's a short narrative read of how the operating brain has been running right now: what work is blocked, what Ian On is currently learning, and which documents have gone stale. Think of it as the system's morning standup. From there you drill into the screen you need.
When a lookup fails, the screen shows that separately from having no items. For example, if the message Couldn't load routine candidates. appears, don't take it to mean there are no candidates.
Screens you'll use regularly
- Features — turn Add-on features on and off, and restrict Agent capabilities. Included features are always on; Add-on features start off. Menus for features that are off don't appear, so if you can't find Database connections, Delivery, Messengers, or Email assistant below, turn them on here first.
- Approvals — the queue of actions waiting for a human yes/no (deliveries and risky steps).
- Audit — check the audit log of who did what.
- Organization & members — manage members and teams. Invitation codes are issued in Members → Manage invitations.
- Organization settings — in Organization & members → Settings, set the organization name, logo URL, session expiration, knowledge graph node limit, and more.
- AI providers — manage the organization's AI connections, including self-hosted models, the order they're used in, and Voice Transcription for meetings.
- Database connections — connect SQL databases so the AI can query them live, and manage access and write permissions.
- Delivery, Messengers, and Email assistant — manage the organization settings for outbound delivery, Discord, and the Gmail assistant, each on its own screen.
- Agents — add agents with Create agent, and set what they can reach and what they're allowed to do. Pick an agent to see its run status and AI model, and to Edit, Restart, or Delete it. Turn installed extensions on and off in Extensions.
Diagnostic screens
These exist for incident response and tuning. You usually open them only when something points you there.
- Learning quality — check feedback and KPI signals on how work turned out.
- Routines — gather accepted recurring work into routine candidates with Scan for candidates, then Approve a candidate to make it a routine.
- Access sync — check the sync status of team and member access permissions.
- Data access — a screen with three tabs: Data access policies, PII masking rules, and Query audit log. It has no chip of its own; open it from the Query audit log link on the Audit screen. If you've turned on Database connections, it also opens as tabs on the Database connections screen.
Visibility
Every screen here is limited to owners and admins, so managers and members don't see the Admin menu at all. If you have a lower role and can still see these screens, tell your owner — every role change is recorded in the audit log.